
Market · Biomethane ·
Marine freight and diesel differentials strengthen the case for biomethane
By AVENTRA
Higher shipping costs and diesel differentials highlight the value of regional biomethane supply, supported by long-term contracts and transparent cost structures.
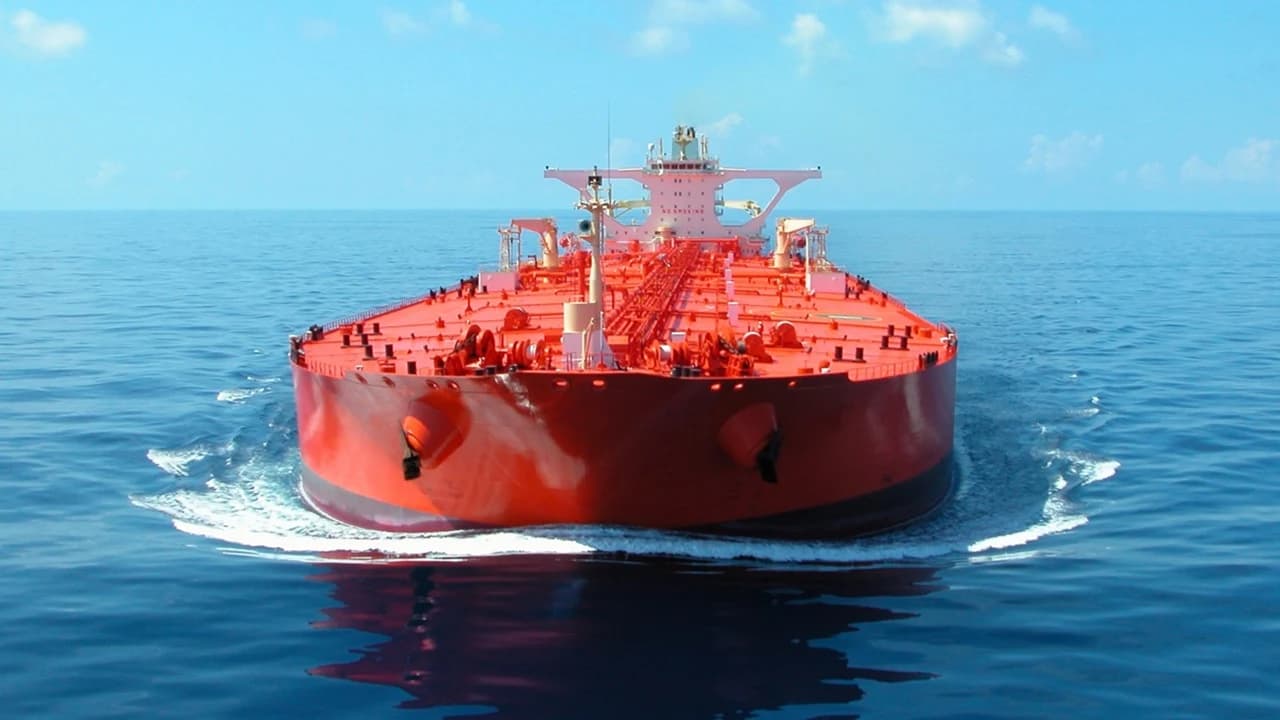
Diesel pricing requires a view beyond crude oil. Product differentials, marine freight, exchange rates and import handling costs determine the replacement cost of imported fuel. For biomethane produced from sugarcane industry residues, this environment highlights the economic value of regional supply.
Logistics returns to the foreground
In its 21 October analysis, the International Energy Agency (IEA) reported Gulf-to-Asia large tanker freight above US$37 per barrel in mid-October. Rerouting and delays reduce fleet productivity, with pressure spreading to product tankers. These figures refer to specific routes and should not be applied directly to Brazilian imports.
Brent, crack spreads and freight are distinct components
The diesel crack spread is the difference between diesel and a crude benchmark, expressed in the same unit. It is a gross market indicator, rather than a refinery's net margin. AVENTRA tracks US Gulf Coast ultra-low-sulfur diesel (ULSD) against spot Brent, using EIA data.
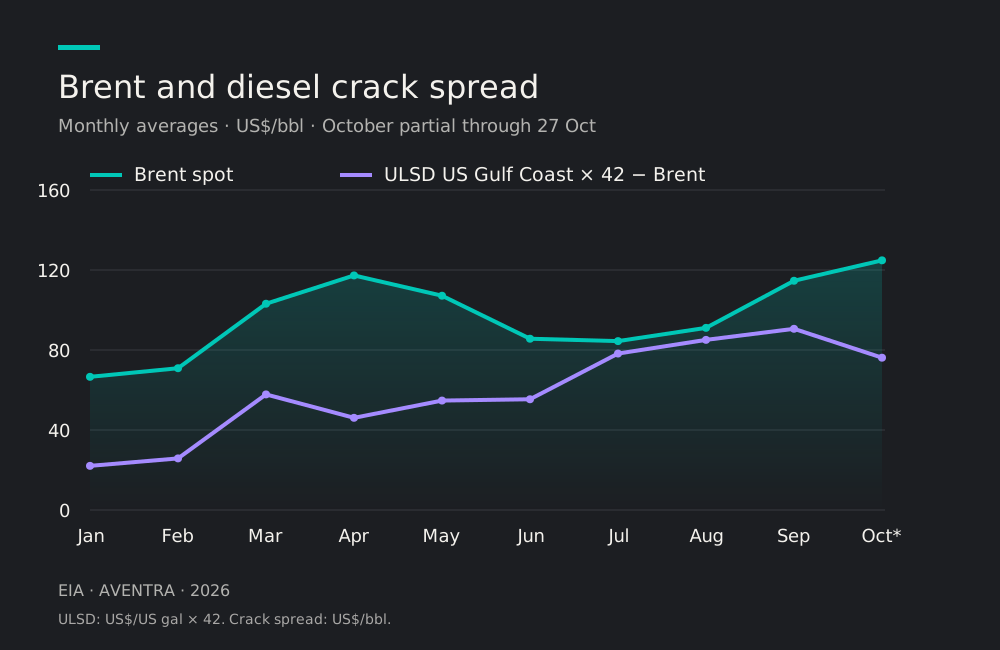
Averages for matching observation dates show Brent at US$66.59/bbl in January and US$124.83/bbl in October through the 27th. The crack spread rose from US$22.07/bbl to US$76.15/bbl over the same comparison. Its September average reached US$90.60/bbl. October is a partial month.
Freight to Brazil is an additional component of import parity. Although market prices reflect logistics and supply constraints, the crack spread does not measure that freight. Adding the spread again to the international diesel price would double-count the product differential.
Energy comparison and import-parity scenario
In AVENTRA's São Paulo scenario, S10 diesel at R$7.32/litre equates to approximately R$194/GJ. A simulated pump price of R$10.21/litre at import parity corresponds to around R$270/GJ. This is an analytical pump-price assumption, not a forecast of price adjustments or an official parity quotation.
The reference biomethane cost range of R$2.80–5.30/m³, including logistics, equates to approximately R$74–141/GJ under the adopted higher heating value (HHV) assumptions. This is 27–62% below the energy cost of diesel at R$7.32/litre. The range draws on a study covering different feedstocks; it is neither an AVENTRA commercial offer nor a demonstrated cost for every vinasse and filter-cake plant.
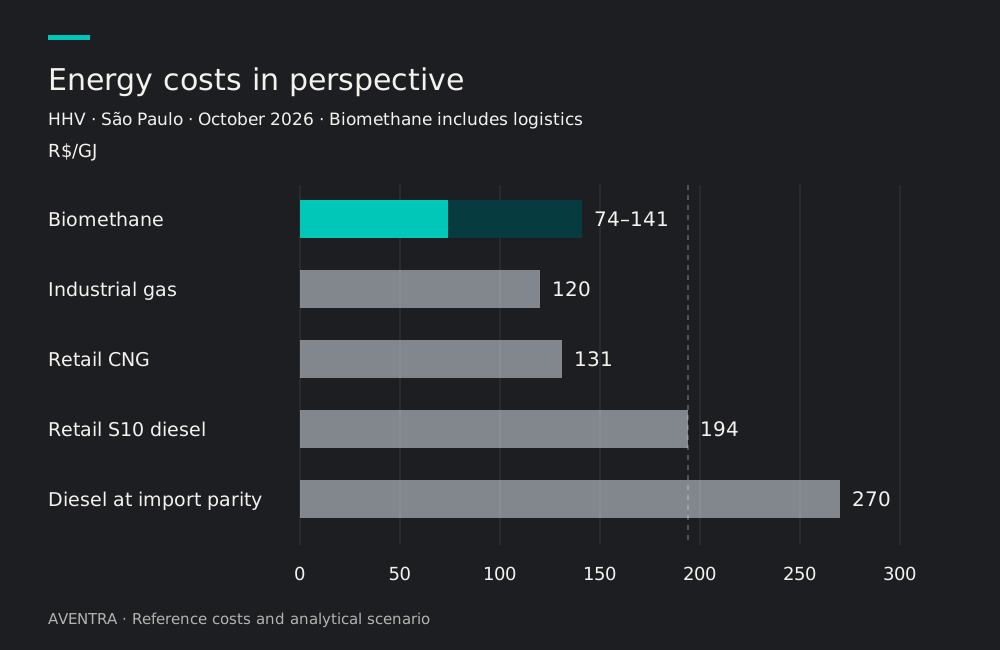
At the lower end, biomethane is also below the industrial natural gas reference (R$120/GJ; R$4.70/m³ at consumption of 100,000 m³/month) and retail CNG (R$131/GJ; R$5.17/m³). At the upper end, this advantage over those two fuels does not hold. These are AVENTRA's São Paulo comparison assumptions, subject to supply conditions.
The approximately R$76/GJ gap between retail diesel and the parity scenario alone is equivalent to the cost of biomethane at the bottom of its range.
Vehicle applications require efficiency and total cost of ownership analysis. In a sensitivity assuming 18% higher energy consumption for a gas vehicle, the range rises to approximately R$87–166/GJ on a diesel-equivalent service basis. This percentage is a comparison assumption; performance depends on the engine, route and duty cycle.
Implications for mills and heavy transport
Regional biomethane reduces direct exposure to marine fuel logistics. Its costs remain sensitive to feedstock productivity, plant availability, electricity, compression, delivery distance and financing.
Long-term contracts can translate this structure into supply predictability. Indexation matters: diesel-linked contracts with a discount retain exposure to diesel prices, while cost-based formulas and domestic indices provide a different risk profile. Assessment should cover price, availability, quality and fleet performance.
Methodology and sources
HHV basis; rounded figures. Brazilian prices and the parity scenario are assumptions supplied in AVENTRA's analysis, referenced to October 2026. The comparison alone does not establish total cost of ownership savings.
Chart: monthly averages of matching daily observations, January to 27 October 2026. Crack spread = US Gulf Coast spot ULSD (US$/US gallon) × 42 − spot Brent (US$/bbl). October partial. AVENTRA calculation using the EIA dataset incorporated into its Radar, consolidated on 28 October 2026. Chart data (CSV).
Sources: IEA — marine freight analysis, 21 October 2026; EIA — spot Brent and US Gulf Coast ULSD. Biomethane range: 2025 study reference cited in AVENTRA's analysis; commercial conditions require project-specific confirmation.